
Most marketing teams have plenty of data. This guide shows how to pick and track B2B marketing KPIs that reflect real business results. You will see examples of marketing KPIs for every stage of the buyer journey, learn the metrics that matter for B2B marketers, and find out how to avoid the most common reporting mistakes.
Understanding B2B Marketing KPIs and What They Measure
People often ask what does KPIs mean in business. The short answer is that a key performance indicator is a number tied to a specific goal, with a target and an owner. So what does KPI measure in practice? Progress.
B2B buying works differently from consumer buying. Sales cycles last for months, several people take part in the decision, and deals are fewer but larger. That is why the marketing KPIs that B2B teams rely on should lean toward lead quality, pipeline and revenue rather than raw reach.
Every KPI is a metric, but not every metric is a KPI. Page views are a metric. A target of 120 sales-qualified opportunities from organic search this quarter is a KPI. Metrics describe what happened, while KPIs show whether you are on track. Monitoring performance indicators on a fixed schedule helps you catch problems long before they reach the revenue line. A good B2B KPI is specific, measurable, linked to a business goal and reviewed by someone accountable.
Activity Metrics
Activity metrics show whether your marketing reaches and engages the right people. They are early signals, so treat them as supporting evidence rather than proof of success. B2B website metrics such as sessions, engagement and conversion rate on key pages belong here. If you need a refresher on how to read them, start with WEB analytics.
| KPI | What it measures | How to use it |
|---|---|---|
| Website Sessions | The total number of website visits over a given period. | Compare traffic by channel, campaign, and audience segment |
| Organic Search Clicks | Visits that come from unpaid search results | Track growth for high-intent keywords and landing pages |
| Engagement Rate | The share of sessions with meaningful action, such as scrolling, clicking or starting a form | Find content that holds attention and pages that need work |
| Content Downloads | The number of gated guides, reports and case studies requested | See which topics attract buyers worth nurturing |
| Email Click Rate | The percentage of recipients who click a link in a campaign | Test subject lines, offers and audience segments |
Pipeline Metrics
Pipeline metrics connect marketing activity to the sales process. They show how many contacts turn into real sales opportunities. One of the most revealing is the MQL to SQL conversion rate, the share of qualified leads that sales accepts as worth pursuing.
| KPI | What it measures | How to use it |
|---|---|---|
| Marketing Qualified Leads (MQLs) | Leads that meet agreed criteria for fit and engagement | Review by source to see which channels bring relevant contacts |
| MQL-to-SQL Rate | The share of MQLs accepted by the sales team as qualified leads | Align scoring rules with sales and fix gaps in the handoff |
| Cost per Lead (CPL) | Spend divided by the number of leads generated | Compare channels, but always check lead quality alongside cost |
| Opportunity Creation Rate | The share of leads that become open sales opportunities | Spot funnel stages where good prospects drop off |
| Pipeline Value | The total potential revenue of open opportunities | Forecast revenue and check whether coverage is enough for the quarter |
Revenue Metrics
Revenue marketing metrics show what marketing contributes to the bottom line. They are the numbers executives care about most, and they make budget conversations much easier.
| KPI | What it measures | How to use it |
|---|---|---|
| Marketing Sourced Revenue | Revenue from deals where marketing generated the first contact | Show direct contribution and defend the budget |
| Marketing Influenced Revenue | Revenue from deals where marketing touched the buyer at any stage | Reveal the role of content and nurturing in long cycles |
| Customer Acquisition Cost (CAC) | Total sales and cost to win one customer | Track by channel and compare with average deal value |
| Customer Lifetime Value (CLV) | Revenue expected from a customer over the whole relationship | Prioritize segments that stay, renew and expand |
| Win Rate | The share of opportunities that become customers | Find weak stages and check whether leads fit your ideal profile |
Customer lifetime value in B2B deserves extra attention, because renewals and upsells often outweigh the first contract. Compare it with CAC: a healthy LTV:CAC ratio is usually around 3:1, though the optimal value depends on your business model. Also look at B2B customer acquisition vs retention cost, since keeping an existing account usually costs far less than winning a new one, so retention belongs in your plan from the start.
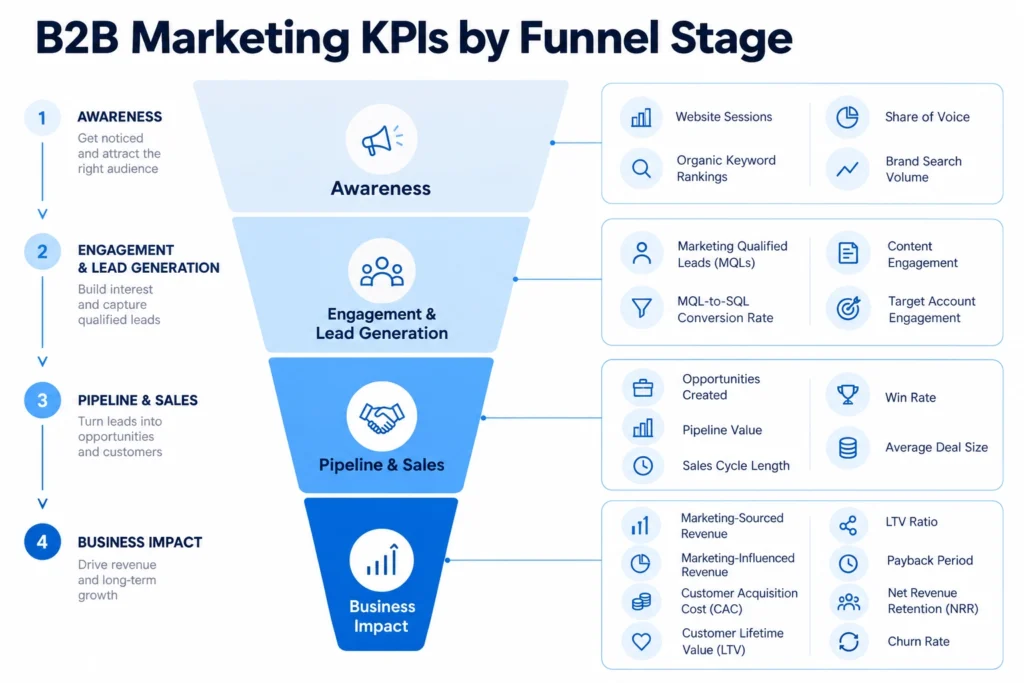
Marketing KPIs by B2B Funnel Stage
Each funnel stage has its own job, so it needs its own indicators. Mixing them produces a distorted picture, for example when top-of-funnel traffic is judged by revenue. Here is how B2B funnel metrics usually line up.
How to Choose the Right B2B Marketing KPIs for Your Team
If you are wondering how to choose marketing KPIs, work through five questions:
- Business and goals. Start with what the company needs this year, and keep only the KPIs that support it.
- Funnel stage and sales cycle. Long cycles need leading indicators, such as engaged accounts, while shorter ones can rely on closed-won revenue.
- Industry, business model, and growth stage. For instance, the marketing KPIs that matter in the construction industry may differ from those in the tech industry due to construction marketing specifics.
- Target audience and channels. Match the indicator to the channel’s real job, for example cost per opportunity for LinkedIn and organic leads for SEO.
- Data availability and sales alignment. Agree with sales on what counts as an MQL, an SQL and an opportunity, then record the goal, target, data source and owner in a simple KPI marketing B2B plan.
Setting KPI Targets and Benchmarks
Begin with your own baseline. Look at the last six to twelve months and note where each indicator actually stands. A target without a starting point is only a wish.
External B2B marketing benchmarks are useful as a sanity check, but they vary by industry, deal size and channel mix. B2B digital marketing benchmarks for conversion rate or cost per lead from a different market can easily mislead you. The same goes for B2B content marketing benchmarks: a competitor’s publishing pace says little about their pipeline.
Tools and Methods for Measuring Marketing KPIs
How to measure B2B marketing without drowning in spreadsheets? Combine web tracking, CRM data and clear reporting. The table below shows which tools cover which indicators.
| Tool category | Examples | What it helps measure |
|---|---|---|
| Web Analytics Tools | GA4 | Website sessions, conversions, engagement, traffic sources |
| SEO Tools | Google Search Console, Semrush, Ahrefs | Keyword rankings, organic visibility, branded search, clicks |
| CRM Systems | HubSpot, Salesforce | MQLs, SQLs, opportunities, pipeline value, win rate, revenue |
| Advertising Platforms | Google Ads, LinkedIn Ads, Meta Ads | CPC, CPL, conversions, campaign ROI |
| BI & Dashboard Tools | Looker Studio, Power BI, Tableau | Data from multiple sources, KPI dashboards, performance reporting |
Attribution models. Attribution decides which touchpoint gets credit for a deal, and the main options are first-touch, last-touch and multi-touch. For long cycles, multi-touch gives the fairest view.
Conversion tracking. Set up key events such as form submissions, demo requests and calls, and tag campaigns with UTM parameters. If the setup feels complicated, Asparagus can help you track user behavior from the first click to the final form.
CRM tracking. Record the original source, lifecycle stage and deal value for every contact, since good ROI tracking for B2B content marketing depends on seeing which articles were part of closed deals.
Dashboard reporting. Build B2B marketing analytics dashboards by audience: executives need revenue and pipeline, the team needs campaign detail. Place B2B marketing metrics ROI next to spend so results are read in the context of investment.
Common Marketing KPI Mistakes in B2B
- Tracking too many indicators. Twenty KPIs mean no priorities.
- Chasing vanity numbers. Followers and impressions rarely explain revenue.
- Skipping the sales conversation. Without shared definitions, reports will always be disputed.
- Ignoring lead quality. A high number of leads with low conversion rates only adds more contacts to the CRM.
- Judging B2B marketing performance metrics in isolation. A cheap lead that never converts has little value.
- Copying benchmarks blindly. Your market and deal size are unique.
- Never revisiting the list. Goals change, and so should your indicators.
A Recommended Starter Set of B2B Marketing KPIs
If you are building your list from scratch, these are the top B2B marketing KPIs to begin with:
- Organic sessions or clicks for demand and visibility
- Conversion rate on key pages for website effectiveness
- MQLs for lead volume and relevance
- MQL-to-SQL rate for the quality of the handoff
- Pipeline value for future revenue potential
- Win rate for sales efficiency
- CAC for cost control
- Customer lifetime value for long-term profitability
Add one or two indicators specific to your industry, and review the whole set every quarter.